Last Updated on July 24, 2023 by Calvyn Ee
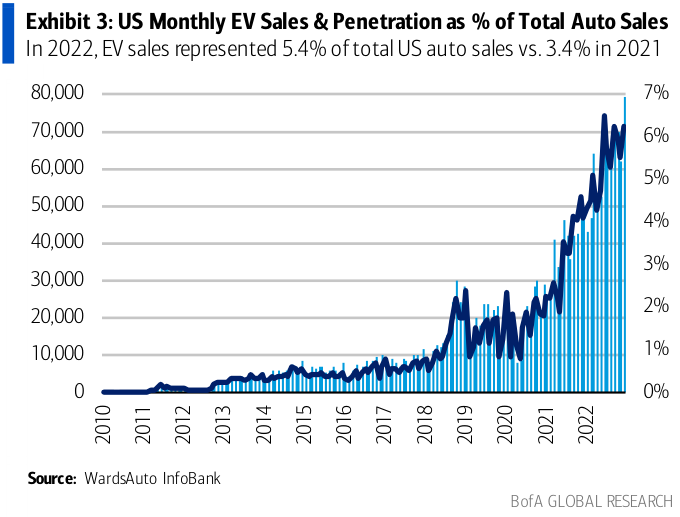
The Bank of America (BofA) noted that EV penetration hit an “all-time high” of 5.5 percent in 2022; sales had grown by 61 percent year-over-year (or 279,000 units) that’s helped by “robust growth” of 52 percent year-over-year (72,000 units) in the fourth quarter of 2022. With newer EVs planned to be released and the revision of the Inflation Reduction Act’s (IRA) “Clean Vehicle Credit” tax reliefs, it’s evident that EV penetration will increase over time. In fact, BofA believes that penetration rates will be up to “7 percent” for 2023.
EV Popularity and Affordability
In January, Tesla announced that it was cutting the prices on its “most popular models.” Not long after, Ford followed suit by slashing prices for its Ford Mustang Mach-E lineup. Other automakers have yet to follow suit, with Renault’s chief executive Luca de Meo even criticizing Tesla’s decision to slash prices. Luca says it’s akin to “destroying value for the customer.”
However, Tesla suddenly took a different approach in the middle of February, hiking the price of the Model Y Performance to $58,990 in light of the IRA’s EV tax credit expansion. On the other hand, the rear-wheel drive Model 3 sedan got a $500 cut; it’s now priced at $42,990. Both cars are still eligible for the EV tax reliefs.
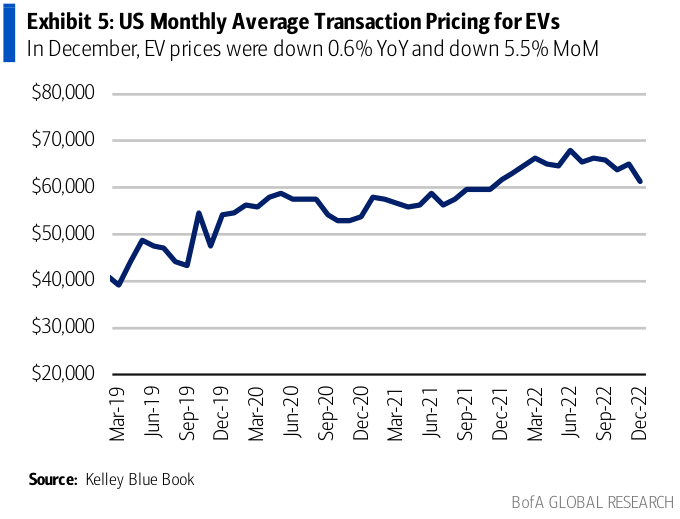
The average transaction price (ATP) of EVs in 2022’s fourth quarter reached approximately $63,500 in January – a modest 5 percent increase from the previous year’s fourth quarter but down 5.5 percent month-on-month in December. Meanwhile, the “price differential between EVs” and conventional non-hybrid (or internal combustion engine, ICE in short) vehicles went down around $2,400 quarter-on-quarter to $18,300. This is good news for EV affordability, which may further benefit from the IRA’s clean vehicle tax credits.
Overall, the “annual spending on passenger EVs” has gone up to $388 billion in 2022, a marked increase of 53 percent compared to the previous year. While it’s still a modest sum compared to global auto sales, 60 percent of total EV spending happened in the last 18 months; in fact, EV sales may continue to set new records. And as sales continue to increase and the market share decreases for some automakers, it becomes critical to revamp EV penetration strategies to regain that market share.
Competition is Good
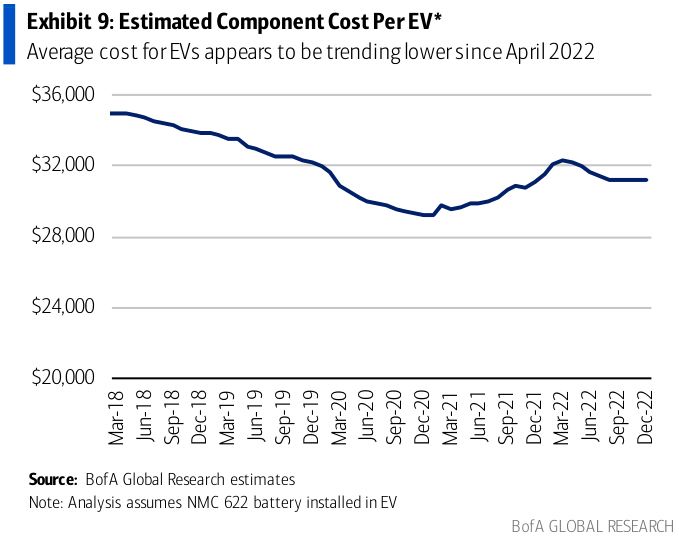
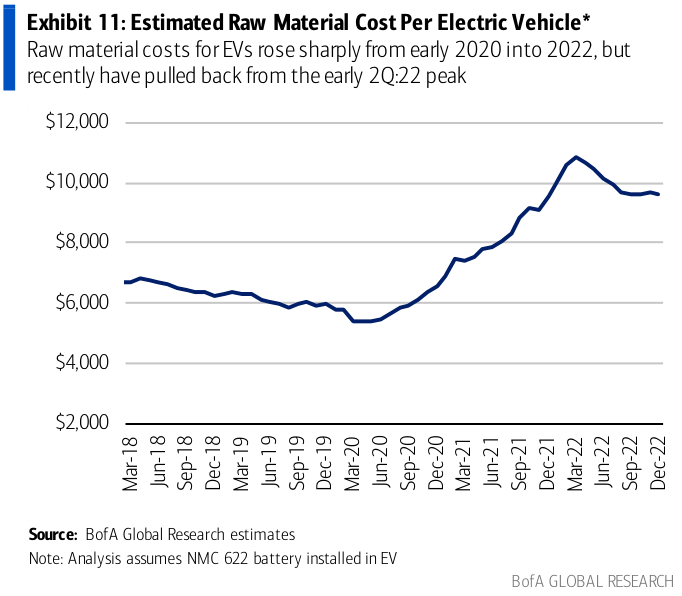
Of course, consumers benefit significantly as this competition drives newer, better models to the market, accompanied by potentially lucrative incentive schemes to attract buyers. Component and raw material costs have also seen a notable downtrend, which may help keep costs relatively affordable. Automakers will need to be careful with their pricing strategy, however. While the lower pricing can draw greater demand, it could make EV investments much “less attractive for OEMs” who are “currently losing money” on making EVs.
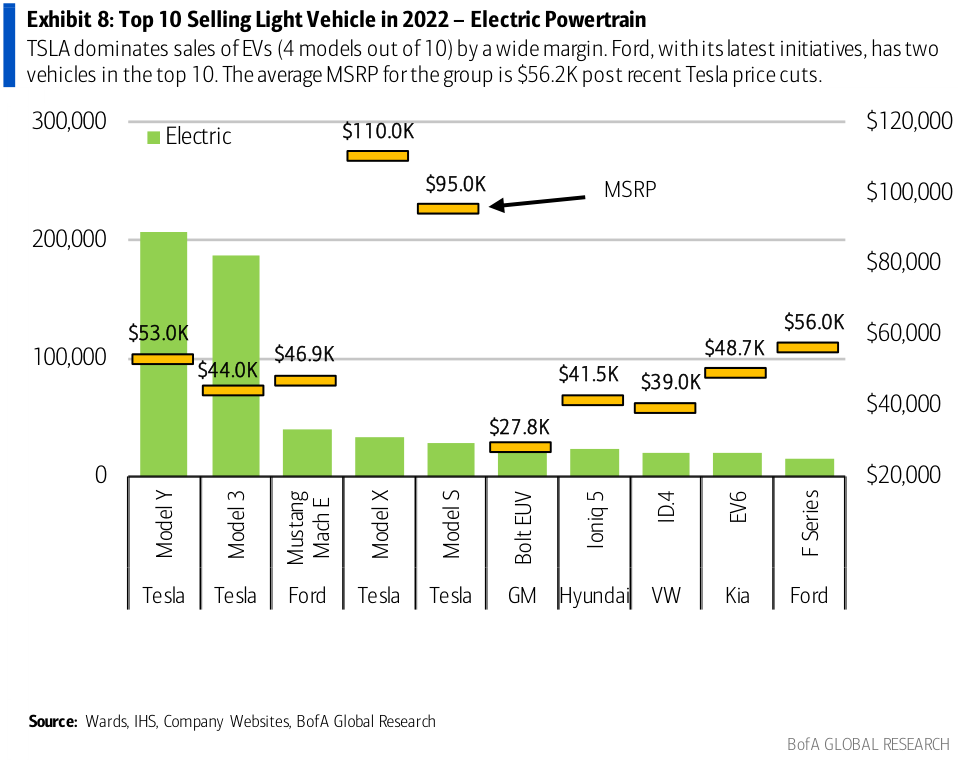
At the moment, Tesla is currently leading in consumer sentiment: 44 percent of shoppers are “very likely” or “somewhat likely” to consider buying a Tesla. Tesla’s market share in 2022 was also sizeable, eclipsing the next 15 auto brands combined. As competition ramps up, time will tell if Tesla can retain its influence through the rest of the year.
Growing Pains
The current EV infrastructure and charging network will also be a key component to promote greater EV penetration. Currently, Level 2 charging infrastructure has seen a marked rise in consumer satisfaction, aided by improvements made to the said infrastructure. For a while, Level 2 charging declined due to its “cost of charging.” However, compared to DCFC charging, satisfaction has seen an interesting reversal as DCFC satisfaction drops due to higher charging costs, limited availability, and limited charging rates due to various conditions.
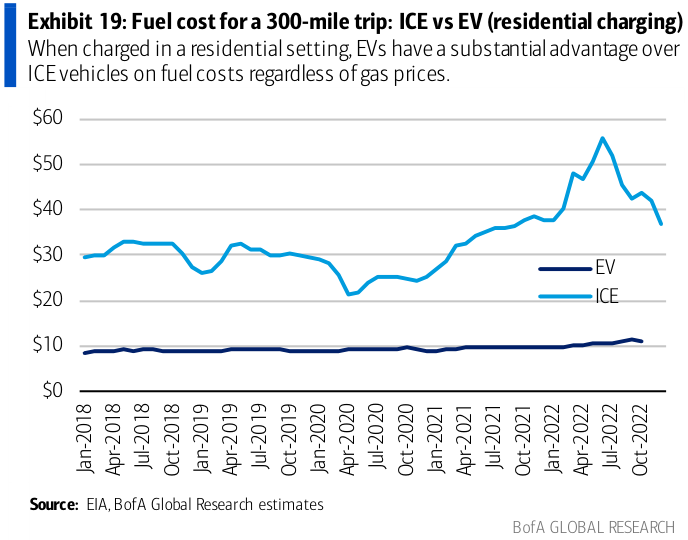
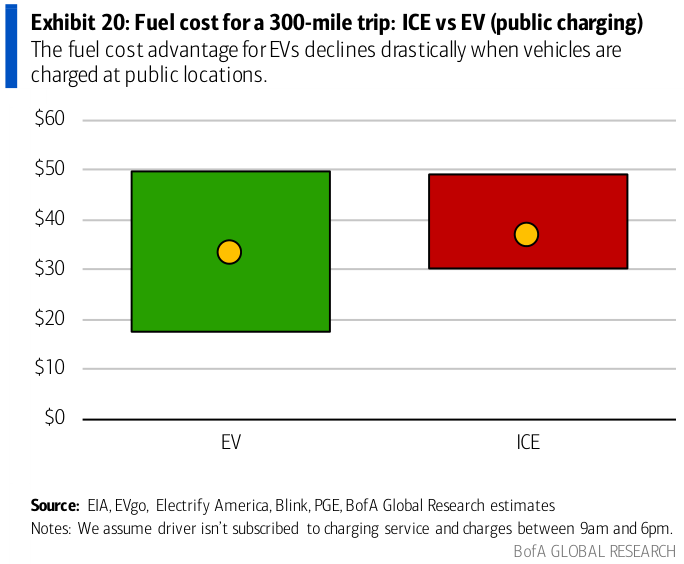
This is especially important as declining gas prices have led fuel costs of EVs and ICEs to reach “close to parity.” EVs are still at an advantage when recharged in a residential setting, but that cost advantage when charging at “public locations” drops to less than $4. As a result, interested buyers who don’t have access to “private residential charging” would view owning an EV as a less attractive option than a regular hybrid electric vehicle.
Further policy changes and introductions could potentially help encourage public charging station development and improve the “supply chain of critical minerals and battery components” for EV production. These will hopefully lead to even greater EV adoption within the United States starting this year.

![The 5 Cheapest Electric SUVs Available Today [2023]](https://www.vinfreecheck.com/wp-content/uploads/2022/09/The-5-Cheapest-Electric-SUVs-Available-Today-2023-150x150.jpg)
![Best Off-Road Vehicles for the Road Less Travelled [2023]](https://www.vinfreecheck.com/wp-content/uploads/2022/09/Best-Off-Road-Vehicles-for-the-Road-Less-Travelled-2023-150x150.jpg)